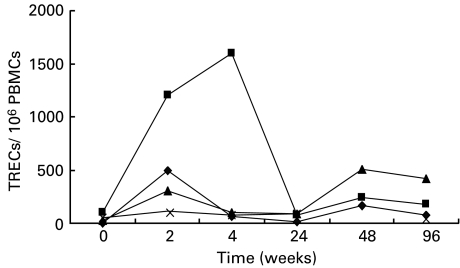
Fig. 4.
Longitudinal analysis of TRECs in patients with very low pre-treatment TREC values. Individual TREC values showed a distinct pattern of variations in patients treated with HAART and IL-2 versus HAART alone. (♦), Patient no. 8, HAART + IL-2; (▪), patient no. 11, HAART + IL-2; (▴), patient no. 8, HAART; (×), patient no. 10, HAART.

