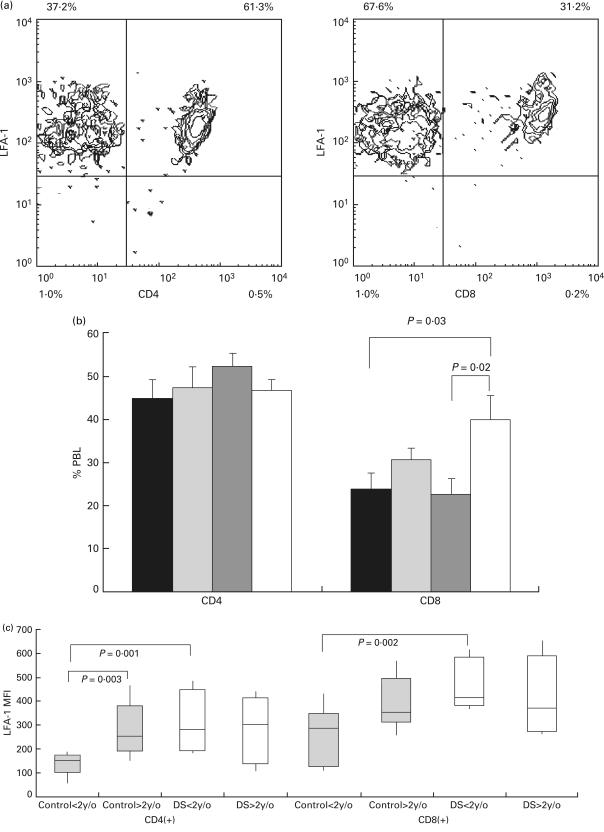
Fig. 2.
Proportions and expression levels of LFA-1 on CD4 + and CD8 + lymphocytes in DS patients and control groups. (a) Two-colour flow cytometric analysis of peripheral blood lymphocytes in a typical experiment. The proportion of CD4 + lymphocytes (left panel) and CD8 + lymphocytes (right panel) were measured. Because essentially all lymphocytes expressed LFA-1, double positive populations (right upper quadrants) of lymphocytes for CD4/LFA-1 and CD8/LFA-1 staining were analysed for the level of LFA-1 expression. (b) The percentage of CD4 (left panel) and CD8 (right panel) expressing cells in lymphocytes were analysed in younger control children (▪, n = 10; mean age 7 years 6 months, CD4 percentage: 44·9 ± 4·4, CD8 percentage: 23·6 ± 3·8), older (more than 2 years of age) control group ( , n = 8; mean age 8 years 3 month, CD4 percentage: 47·3 ± 4·9, CD8 percentage: 30·3 ± 2·8), younger (less than 2 years of age) DS patient group (
 , n = 6; mean age 13·1 months, CD4 percentage: 52·1 ± 3·0, CD8 percentage: 22·3 ± 3·8), and older DS patient group (□, n = 6, mean age 11·5 months, CD4 percentage: 46·6 ± 2·4, CD8 percentage: 39·8 ± 5·4). (c) The expression of LFA-1 on lymphocytes on CD4 (left panel) and CD8 (right panel) expressing lymphocytes were analysed on the younger control group (LFA-1 MFI medians on CD4 + cells and CD8 + cells: 152 versus 275), older control group (LFA-1 MFI medians on CD4 + cells and CD8 + cells: 254 versus 334), younger DS patient group (LFA-1 MFI medians on CD4 + cells and CD8 + cells: 278 and 391), and older DS patient group (LFA-1 MFI medians on CD4 + cells and CD8 + cells: 298 and 352). Results are expressed as ranges of values, 25th percentiles, medians and 75th percentiles as in Fig. 1.

