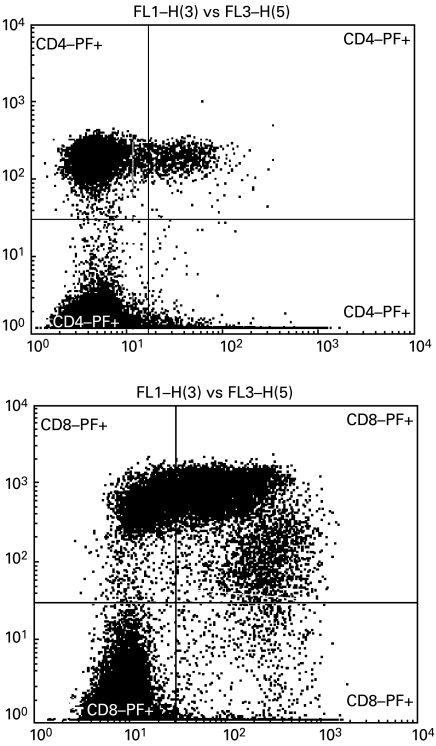
Fig. 2.
Typical profile of perforin-containing CD4 and CD8 cells from B–CLL patients. The cells were stained with anti-CD4 or anti-CD8 MoAbs (y axis) and anti-PF MoAb (x axis) as described in the Methods. Cells were gated on the lymphocyte population and quadrant gates were placed based on the isotype controls. Note the two populations of PF-expressing CD8+ cells with bright and dim surface expression of CD8. MFI PF+ CD4+ 41·8; MFI CD8+bright PF+ 78·5; MFI CD8+dim PF+ 288·4.

