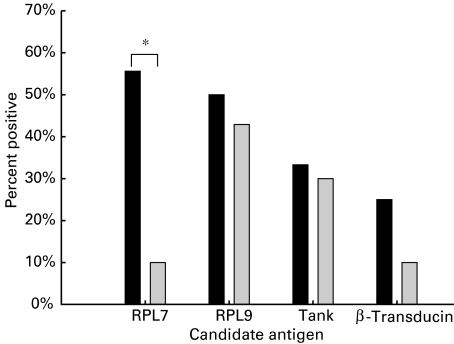
Fig. 1.
The percentage of patients in each group showing positive immunoreactivity to each of the candidate antigens is shown. Sera were judged as positive when the mean O.D. of duplicate wells exceeded the mean plus two standard deviations of a normal range of control sera (n = 11) run in parallel with the assay. A significant association of immuno-reactivity to RPL7 and the presence of CAD is indicated by the asterisk (Fisher's exact test P < 0·05). ▪, CAD (n = 9); ▪, non-CAD (n = 10). *P < Fisher's exact test.

