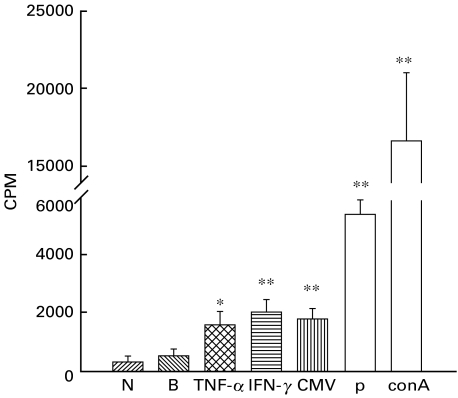
Fig. 6.
Proliferative response of allogeneic murine T cells from MCMV-infected mice to resting or treated biliary epithelial cells at cell ratio (biliary epithelial cells: T cells = 1 : 4). N: negative control (T cells alone); B: background control (T cells incubated with untreated biliary epithelial cells); INF-γ: T cells incubated with INF-γ‐stimulated biliary epithelial cells; CMV: T cells incubated with murine cytomegalovirus-infected biliary epithelial cells (cultured cells in each well of 6-well culture plates incubated with 1·5 × 105 pfu murine cytomegalovirus for 3 days in growth medium); P: positive control (mixed BALB/c T cells and C57BL/6 T cells); ConA: BALB/c T cells stimulated with concanavalin A at 10 μg/ml. *P < 0·05; **P < 0·01, when compared with negative control (T cells alone). Each value represents the mean of six replicates; error bars represent SEM.

