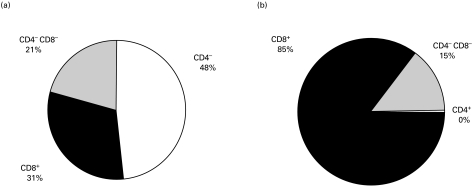
Fig. 2.
Isolation of CD8+ T lymphocytes by magnetic cell sorting. Percentages of CD4+, CD8+ and CD4−CD8− cells are shown before (a) and after (b) magnetic cell sorting. The isolated CD8+ fraction consisted of 85 ± 7% CD8+ T lymphocytes, practically no contaminating CD4+ T lymphocytes and 14 ± 7% CD8−CD4− cells, which could not further be characterized by CD3, CD14, CD16, CD56, CD19 and CD11b surface markers (data not shown). Values are mean ± s.e.m., n = 22.

