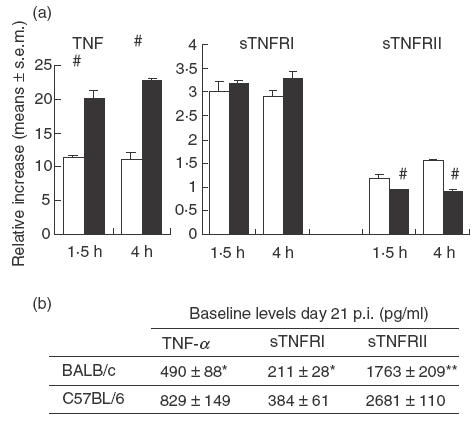
Fig. 2.

Circulating levels of TNF-α and its soluble receptors in LPS-challenged mice. (a) The relative increase in either TNF-α or its soluble receptors was calculated according the following formula: values in LPS-challenged mice/baseline values at day 21 p.i. (mean ± s.e.m.); #P < 0·01 when compared with BALB/c mice. □, BALB/c; ▪, C57BL/6. (b) Results indicate the mean ± s.e.m. (pg/ml) of 4–5 mice/group (one of two experiments with similar results). Different from C57BL/6 mice, *P < 0·05 and **P < 0·01.
