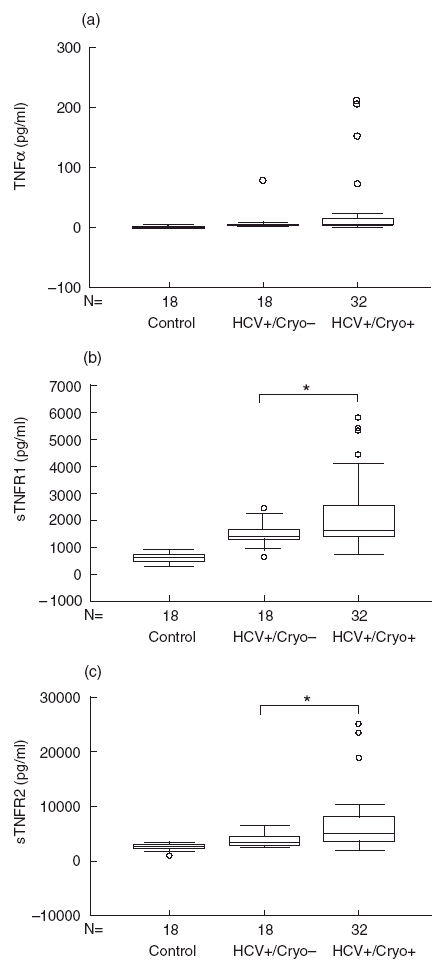
Fig. 1.

Elevated TNFα, sTNFR1 and sTNFR2 concentrations in patients with HCV-MC. TNFα (a), sTNFR1 (b) and sTNFR2 (c) were measured in patients with HCV-MC (HCV+/Cryo+) and compared with healthy controls (control) and with patients with HCV infection without MC (HCV+/Cryo–). In the box-plot representation, horizontal lines represent the median for each sample, open circles represent outside values (< 0·05, compared with respective control).
