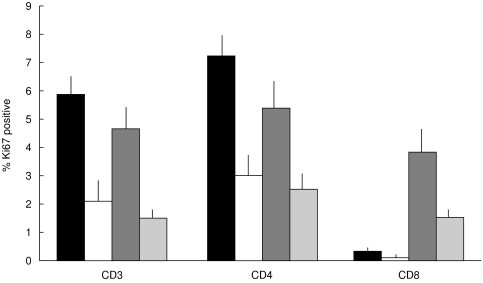
Fig. 4.
A comparison of the proliferation frequencies of different T-cell subsets in colorectal carcinomas, tonsils and Peyer’s patches. The mean percentages (and standard errors) of proliferating CD3+, CD4+ and CD8+ T cells are compared in tonsillar TCZ (▪), Peyer’s patch TCZ (□), colorectal carcinoma IEL ( ) and colorectal carcinoma stroma (
 ). The CD8+ subset is proliferative in the carcinoma specimens, but not in the tonsils or the Peyer’s patches.

