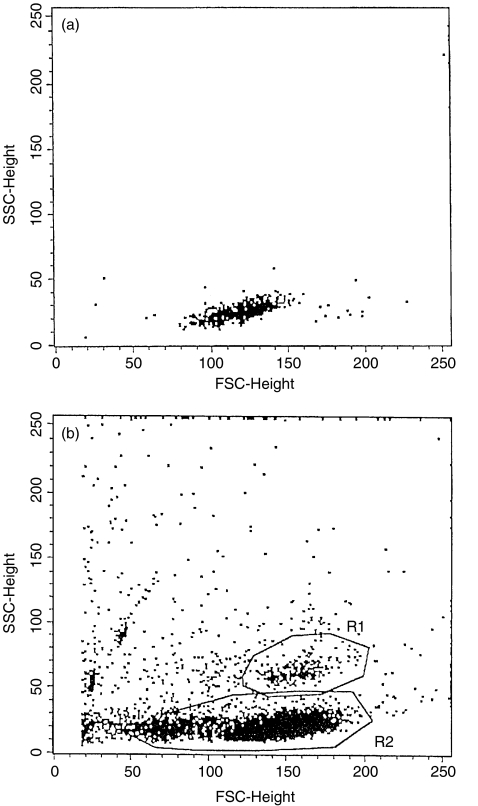
Fig. 2.
Light scatter analysis (FSC versus SSC) of unstimulated peripherial blood CD3+ T cells (a) and of separated and stimulated CD3+ T cells (b). Peripheral venous blood sample was obtained from a healthy control. Cell separation and stimulation was performed using magnetic beads coated with anti-CD3 monoclonal antibodies. After stimulation of the CD3+ T cells a distinct population of granulated cells appeared (R1).

