Fig. 4.

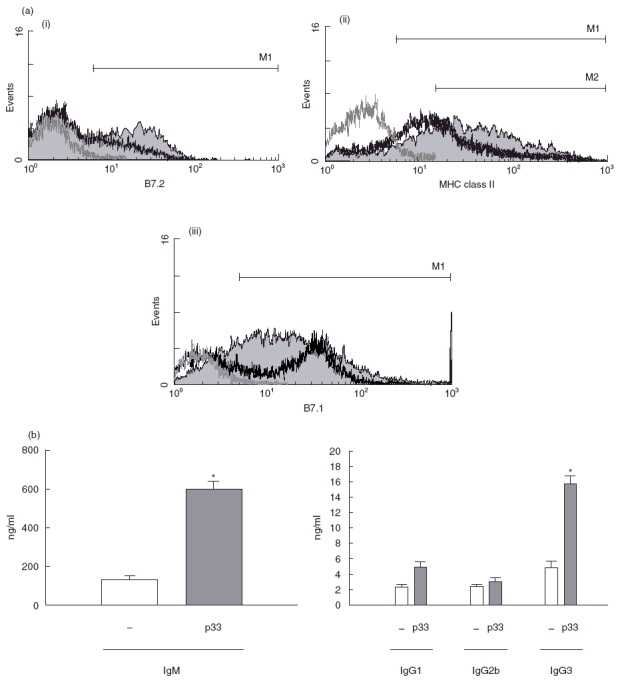
(a) p33 up-regulates expression of B-cell activation markers. B cells were cultured in the presence of macrophages with p33 (20 μg/ml) or medium alone for 3 days. The cells were then stained with PE-labelled antimouse CD19+ and FITC-labelled antimouse B7.1, B7.2 or FITC-labelled antimouse CD19 and PE-labelled antimouse MHC class II molecules. CD19+ cells were gated and analysed for the expression of surface molecules mentioned above. We show on p33 stimulated B cells (grey fill histogram): (i) expression of B7.2 + B cells; (ii) expression of MHC class II + B cells; (iii) expression of B7.1 + B cells. In all figures thick black line histograms represent B cells cultured without stimulus, thin grey line histograms represent unstained cells. This set of results is representative of three individual experiments. (b) p33 effect on immunoglobulin secretion. B cells in the presence of macrophages (3 × 10⁶/well) were incubated with medium alone (□) or with 20 μg/ml p33 for 6 days. Cell free supernatants were harvested and analysed for Ig isotype production by ELISA. Data are presented as represent the mean ± s.d. The asterisks indicate significant differences (*P < 0·05,**P < 0·01) compared with unstimulated B-cells.
