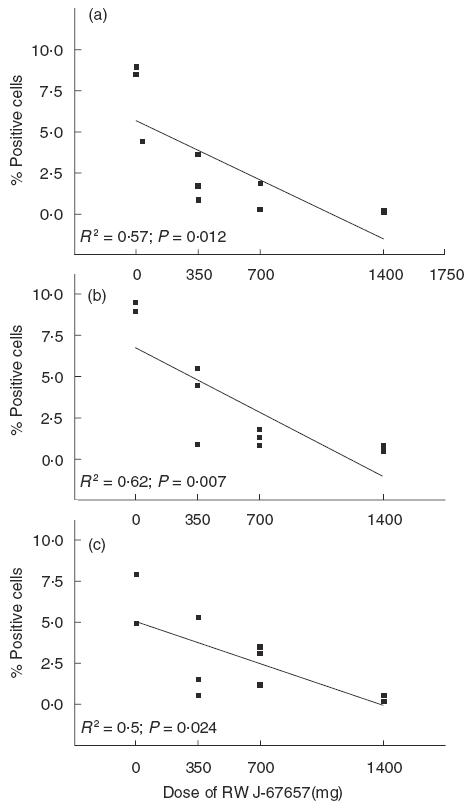
Fig. 2.

Percentage of IL-1β (a), TNFα (b) and IL-12 (c) producing monocytes of individuals with (350, 700 or 1400 mg) or without treatment with RWJ-67657. The line represents the regression line. Each square represents an individual. The P-value is given when the slope of the regression line significantly differs from 0.
