Figure 1.


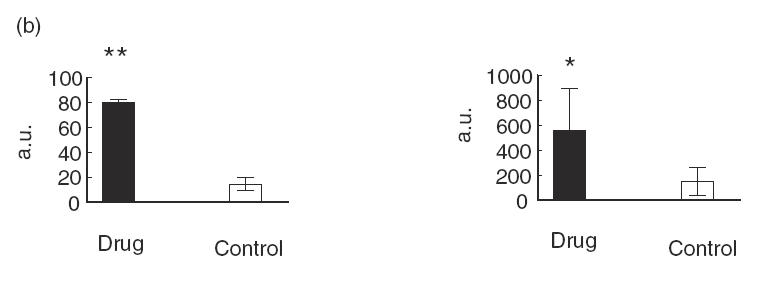
(a) SDS–PAGE and autoradiography of in vitro translated and immunoprecipitated 35S-Asp123CYP3A4his6 and 35S-CYP2C9his6. 35S-Asp123CYP3A4his6 and 35S-CYP2C9his6 were loaded in 25 μl of sample immunoprecipitate (IP) (lanes 1–4 and lanes 7–10) or 2·5 μl of the diluted reaction mixture (lanes 5 and 6) as described in Materials and Methods. Total 35S-Asp123CYP3A4his6 (lane 5) and 35S-CYP2C9his6 (lane 6) and immunoprecipitations with 1:150 dilution of human sera: drug treatments (lanes 1,2 and lanes 7,8) and controls (lanes 3,4 and lanes 9,10). Paediatric liver transplants on FK506: LivTx 441 (lane 1) and LivTx 621 (lanes 2 and 8); paediatric kidney transplant on CyA KidTx 2023 (lane 7) and control sera C5 (lanes 3 and 9) and C6 (lanes 4 and 10). The bar graphs (b) represent mean and s.d. of immunoprecipitated bands quantified by laser scanning of the autoradiographs and densitometric analysis using Molecular Dynamics Image Quant software version 3.2. Differences in reactivity between eight control subjects (□) and four patients on drug treatments (▪) is statistically significant at **P < 0·01 and *P < 0·05, Student’s unpaired t-test. The graphed values represent arbitrary units (a.u.) of band intensities taken from immunoprecipitations in two independent experiments.
