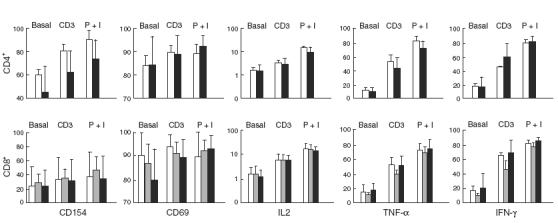
Fig. 1.

Induction of cell surface molecules and cytokines in transformed CD4+ and CD8+ T cell lines. Lines from CVID patients (10 CD4+, 15 CD8+) are compared to controls (five CD4+, 15 CD8+) and to XLA patients (five CD8+) for their response to anti-CD3 (CD3) or PMA + ionomycin (P + I). The mean ± s.e.m. is depicted. □, Controls;  , XLA; ▪, CVID. P > 0·05.
