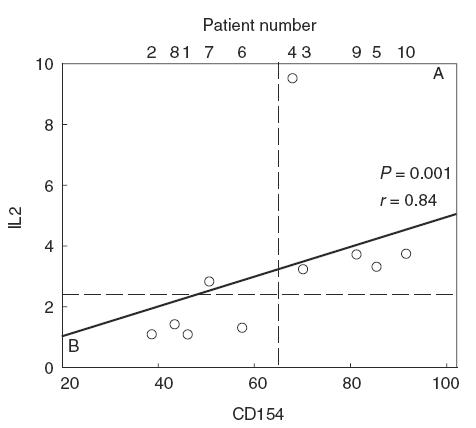
Fig. 4.

The induction of IL-2 by transformed CVID CD4+ T cells upon CD3 engagement significantly correlates with CD154 induction (P = 0·0012, r = 0,84). The broken lines mark the lower limits of normal responses to anti-CD3. B and A patients defined as in Fig. 2b clearly fall below or above the limit for IL-2, respectively, with a single exception.
