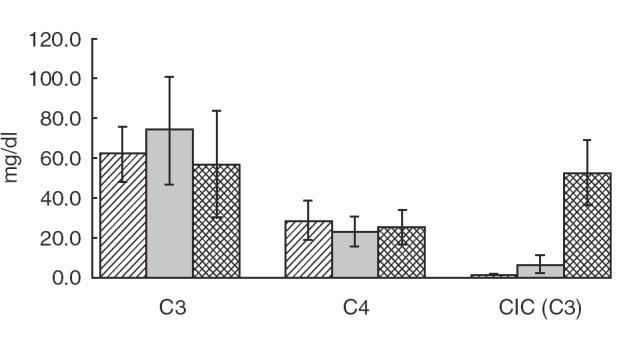
Fig. 3.

Levels of complement C3, C4 and CIC(C3) in the patients with infective endocarditis and controls. C3: P = n.s. (HC versus IE) and P = 0·048 (CC versus IE). C4: P = n.s. (HC versus IE) and P = 0·0007 (CC versus IE). CIC (C3): P = 0·0055 (HC versus IE) and P = 0·004 (CC versus IE).  , Healthy controls;
 , clinical controls;
  , patients’ IE.
