
Fig. 1.
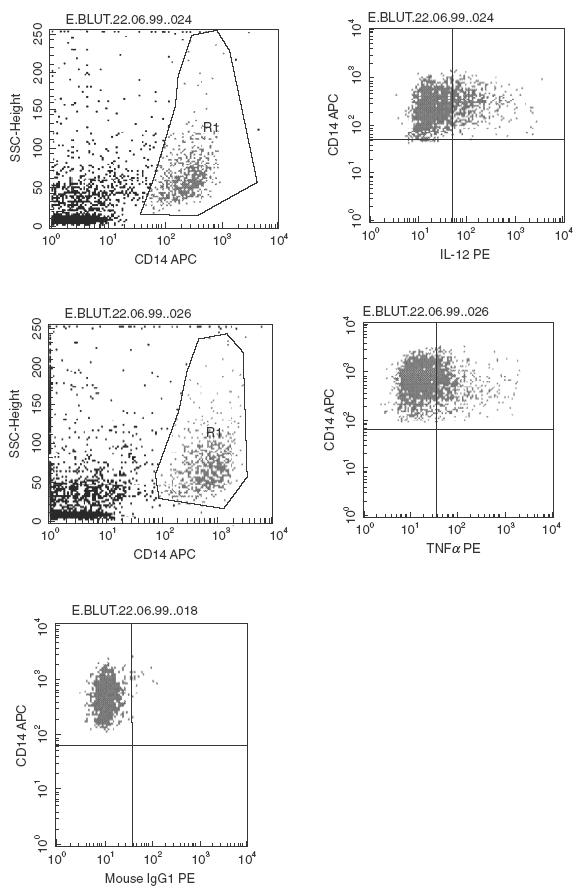
Representative quadrant dot plot analysis of peripheral blood CD14+ monocytes of a WG patient. Monocytes were gated for analysis based on light scattering properties and on CD14 staining. The fraction of positively-stained monocytes displaying intracytoplasmic IL-12 and TNF-α was calculated by quadrant dot plot analysis determined by isotype controls. An isotype control for an intracytoplasmic cytokine staining is also shown.