
Fig. 4.
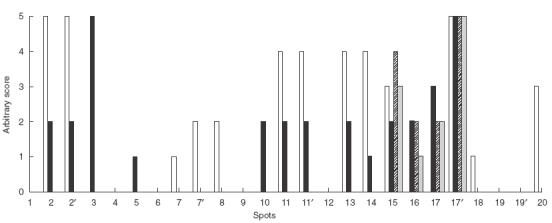
Epitope mapping base on spot staining by polyclonal antibodies from four different sera (four patients: □ A27, ■ A7, A2,
A2, A49).The strength of each reaction was given as an arbitary score based on visualization of the density of staining of the spot above background. For an example see serum A27 in Fig. 3a.