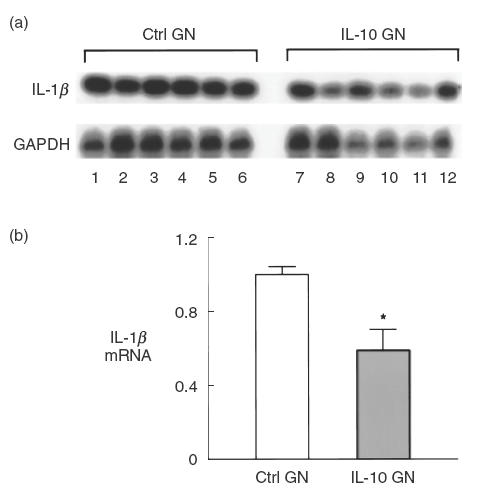
Fig. 5.

IL-1β mRNA expression of control treated and IL-10-treated rats with mesangial proliferative GN. (a) Representative Southern blot analysis of renal IL-1β cDNA from control rats with GN and from IL-10 treated rats with GN. Lanes 1–6 represent cDNA from kidneys of control treated rats with anti-Thy 1 GN and lanes 7–12 from IL-10 treated rats with GN. (b) Reduction in IL-1β mRNA in IL-10 treated rats. Densitometry values for IL-1β were normalized to GAPDH readings, Southern blot analysis was performed on four occasions and the results expressed as the mean densitometry values of these four separate experiments. Values represent fold expression of IL-1β mRNA, with control rats with anti-Thy 1 GN defined as having a value of 1. *P = 0·04 versus control rats with GN.
