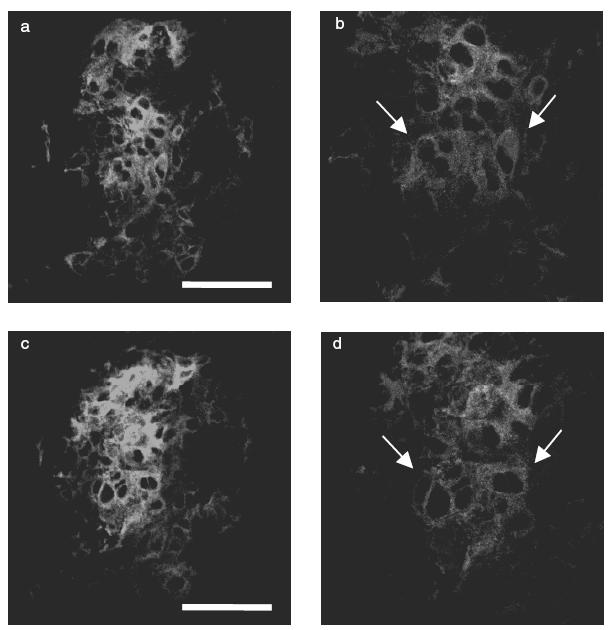
Fig. 4.

Immunofluorescence micrographs showing expression of OX-43 (a, b) and P-selectin (c, d) in representative glomeruli from a rat of the saline group on day 14. (a) Indirect immunofluorescence staining for endothelial cell. (b) Higher magnification of (a), arrow indicates endothelial cell. (c) Indirect immunofluorescence staining for P-selectin in a serial section of (a). (d) Higher magnification of (c), arrow indicates P-selectin positive cell. Scale bar = 50 μm.
