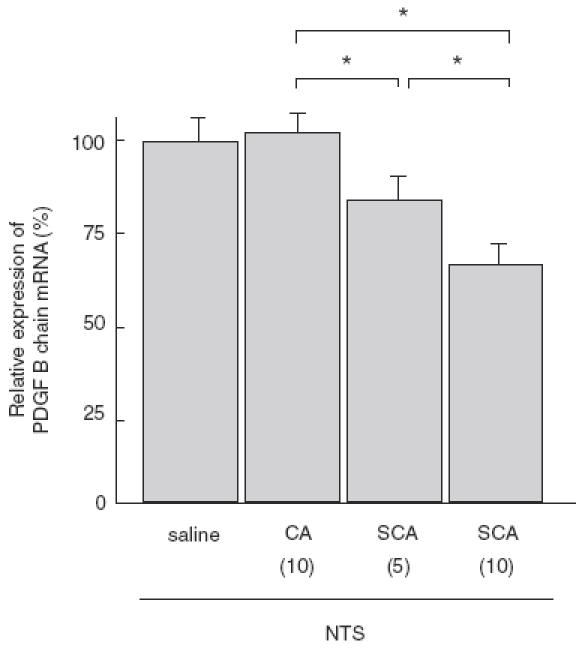
Fig. 8.

Quantitative real-time RT-PCR analysis of relative expression of PDGF B chain mRNA in glomeruli of WKY rats with crescentic glomerulonephritis on day 14. Numbers in parentheses represent the daily dose of each drug in mg/kg. Relative expression of PDGF B chain mRNA is significantly reduced in SCA groups, relative to CA group, in a dose-dependent manner. Data are mean ± SEM of 8 rats in each group. *P < 0·01.
