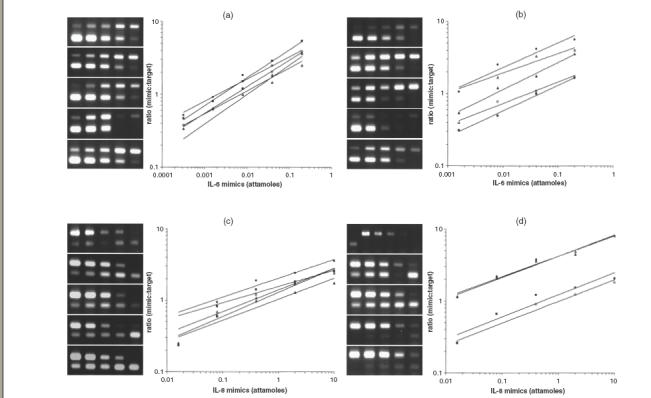
Fig. 6.

The effect of hIL-1β and hTNF-α on the expression of IL-6 (a, b) and IL-8 (c, d) mRNA by competitive PCR. A series of RT-PCR plots from ethidium bromide-stained gels shows the ratio of mimic fragment to target (y-axis) versus mimic fragment concentration (x-axis). Each gel (and each line in the graph) represents one stimulation condition (from top to bottom): no stimulation (filled circle); 1 ng/ml of hIL-1β for 4 h (open square); 1 ng/ml of hIL-1β for 24 h (filled square); 100 units/ml of hTNF-α for 4 h (open triangle); 100 units/ml of hTNF-α for 24 h (filled triangle). Each gel lane represents one PCR reaction with the highest mimic concentration at the left descending in a fivefold series to the right (cDNA amount is constant in each reaction). Target band is the upper band for IL-6, while it is the lower band for IL-8. For each cytokine, initial amount of target cDNA (in attamoles) corresponds to the mimic's amount (x-value), where target/mimic ratio (y) = 1. (a) and (c) are representatives of two experiments for T-HPMC, (b) and (d) are representatives of two experiments for P-HPMC. Note that, on the first gel lane in (d), specific IL-8 band presents when un-diluted cDNA from non-stimulated P-HPMC is amplified in the absence of IL-8 mimic; whereas no band exists when 30-fold diluted cDNA of the sample is amplified in the presence of IL-8 mimic.
