
Fig. 3.
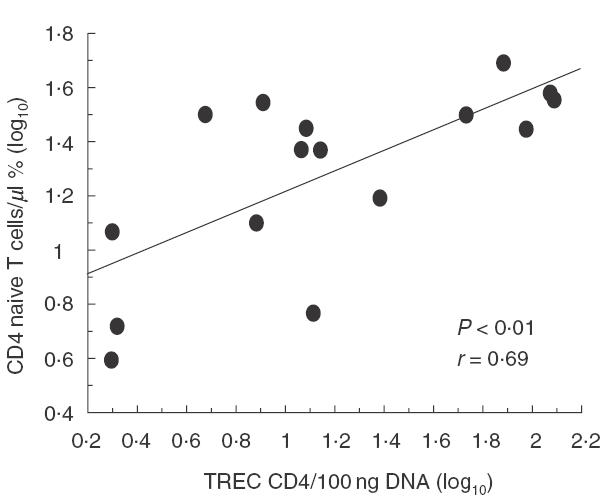
Correlation between percentage of naive (CD45RA+CD62L+) CD4+ T cells and TREC levels in CD4+ T cells (log10). The data indicate that there is a direct correlation between naive CD4+ phenotype and TREC levels in our cohort. Pearson's correlation coefficient (r) and P-value are indicated within the figure.