
Fig. 2.
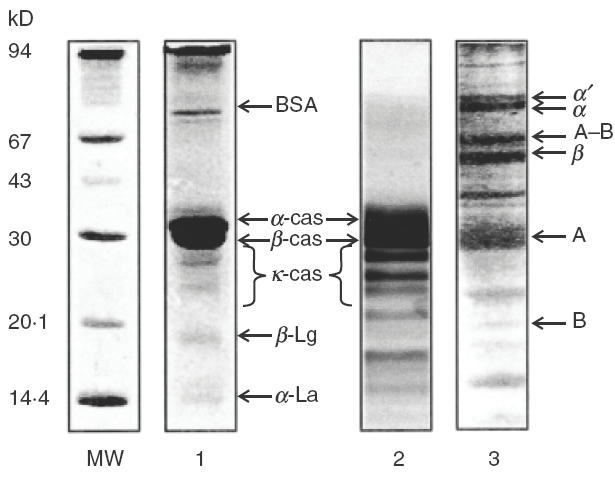
SDS-PAGE analysis of protein extracts. MW: molecular weight markers; 1: CMPextract (under reducing conditions); 2: total casein components (under reducing conditions), 3: soy extract (under non reducing conditions). Gels were stained with Coomasie Blue R 250 (15–25 μg of protein were loaded per lane).