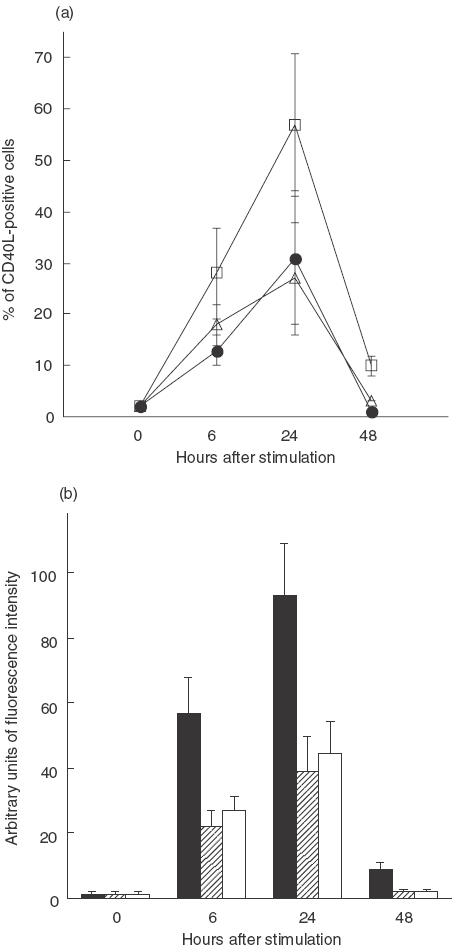
Fig. 2.

Spontaneous and mitogen-induced expression of CD40L on CD4 lymphocytes from control and ribavirin-treated patients. (a) Percentage of CD40L positive cells as assessed by FACS just before (time 0) and at different time-points after stimulation. (b) Intensity of expression of CD40L just before and at different time-points after stimulation, calculated on 1000 positive events as the value of intensity of fluorescence (arbitrary units) of the sample stained with anti-CD40L MoAb minus the value of intensity of fluorescence of the same sample stained with the control antibody. The error bars represent s.d. (a) □, Ribavirin; • controls; ▵, healthy subjects. (b) ▪, Ribavirin;  , controls; □, healthy subjects.
