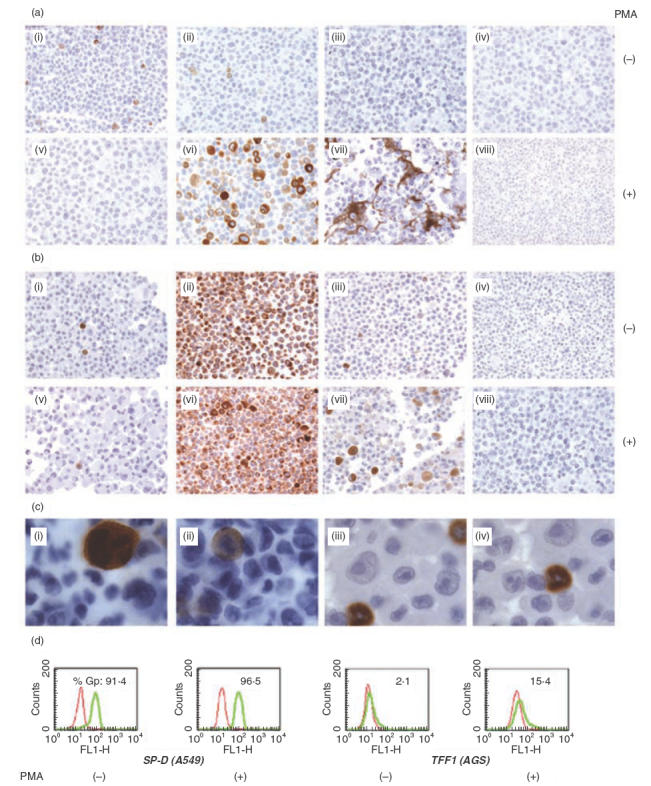
Fig. 2.

Analysis of protein synthesis for gp-340, TFF1, TFF2 and SP-D using immunohistochemistry (a, b and c) and flow cytometry (d), in unstimulated and PMA stimulated (100 ng/ml) AGS (a) and A549 cells (b): i and v, gp-340; ii and vi, TFF1 (a) or SP-D (b); iii and vii, TFF2 (a) or TFF1 (b); iv and viii, control staining using isotype monoclonal antibody Hyb99–1 (IgG1) to substitute the specific antibodies at the same concentration. (c) Intracellular distribution of gp-340 in AGS cells (i and ii) and A549 cells (iii and iv). Original magnifications: (a) and (b) ×200; (c) ×1000. The results displayed represent two independent experiments. (d) FACS analysis demonstrates the PMA effect on the percentage of cells gated positive (%Gp) for SP-D in A549 cells and for TFF1 in AGS cells. The histograms in red represent background staining using control antibodies, as explained in Materials and methods. Data are representative of three independent experiments.
