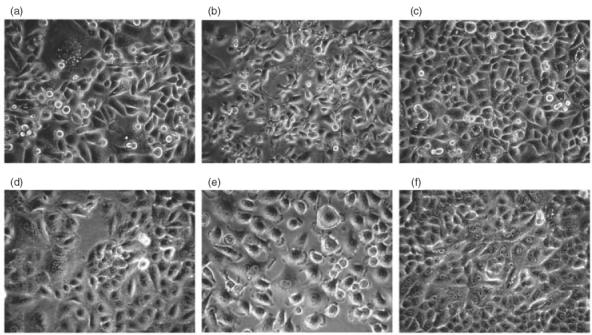
Fig. 5.

Phase contrast microscopy showing the effects of PMA on the morphology of AGS and A549 cells. AGS cells (a) and A549 cells (d) before PMA addition. Morphological changes were observed in most AGS cells after PMA stimulation for 6 h, with asymmetric shape and elongated cytoplasm extending toward one end of the cells (b). The same type of change was not observed in A549 cells, which maintained an even distribution of cytoplasm with stretching edges toward all directions (e). 24 h after PMA addition, the morphology of AGS cells returned to normal (c); A549 cells obtained well-defined borders along cellular junctions in confluence (f). Original magnification, × 200. The images were identical in five independent experiments.
