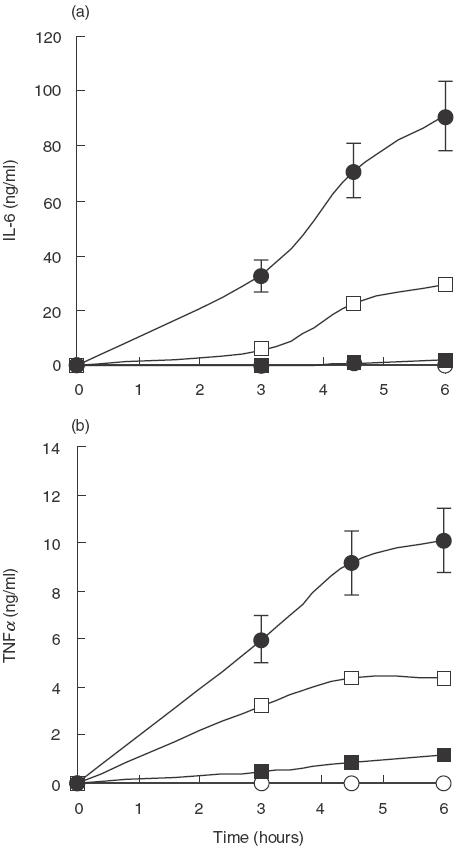
Fig. 2.

Time course analysis of cytokine production over a 6-h period after stimulation with different antigens. Whole blood from five healthy, blood group O subjects was incubated at 37°C with heat-inactivated bacteria (1 × 10⁷ bacteria/ml blood), PPS (10 μg/ml blood), PPS-coated beads (1 × 10⁷ beads/ml blood), uncoated beads (1 × 10⁷ beads/ml blood), and LPS (50 ng/ml blood), sampled at 0, 3, 4·5 and 6 h and analysed for cytokine release. Unstimulated blood was used as a negative control. Results are plotted as the mean of duplicate determinations from the 8 experiments. ○ Control; ▪ PPS S14; • LPS; □ S14. Error bars represent the standard error of the mean
