
Fig. 5.
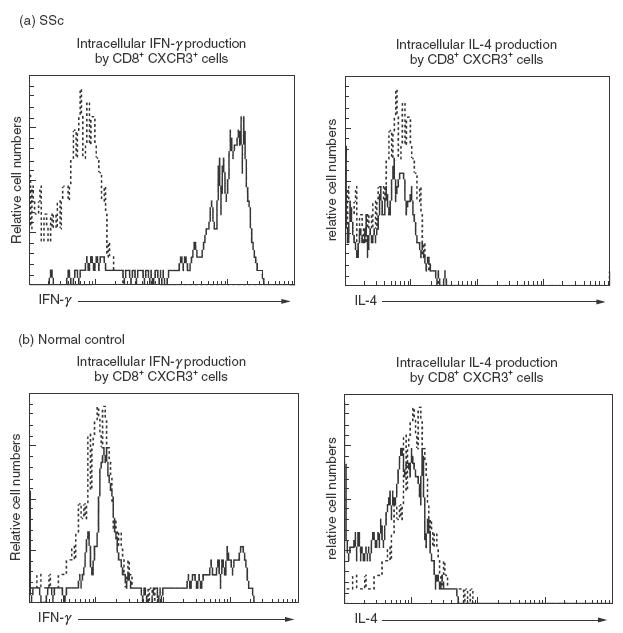
Representative expression of IFN-γ and IL-4 in the cytoplasm of CXCR3+ CD8+ T cells in peripheral blood from (a) a patient with SSc and (b) a normal control. Whole blood samples were activated with phorbol myristate acetate and ionomycin in the presence of brefeldin A. Intracellular cytokine production was determined by flow cytometry with three-colour analysis. Histograms represent live cells gated for expression of CD8 and CXCR3 (——). Staining of control MoAbs (------).