
Fig. 2.
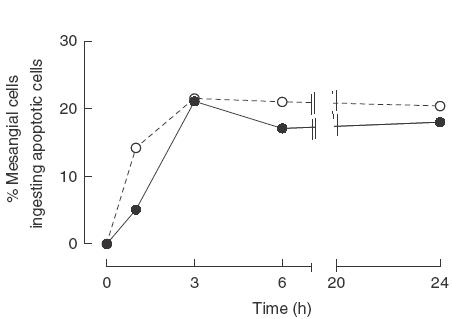
Kinetic of apoptotic RMA cell clearance. Graph showing the percentage of mesangial cells from 129/sv and C57BL/6 mice phagocytosing apoptotic RMA cells at different time-points. The kinetic of the uptake was similar with phagocytosis reaching a plateau phase after 3 h of co-culture. Data shown are representative of three independent experiments. •, C57BL/6; ▴, 129/Sv.