
Figure 1. Meta-analysis of published “hESC” and “differentiation” gene lists.

1959 different genes were found overexpressed in hESCs compared to differentiated tissues by at least two out of 20 independent studies (purple pyramid) (A). Of these, 1076 genes were found by at least three studies, 48 genes by at least 10 studies and only 1 gene (POU5F1) by all studies. Eleven studies provided lists of genes downregulated in hESCs compared to more differentiated samples (yellow pyramid) (B). 1560 genes were found downregulated in hESC by at least two studies, 783 by at least 3 different studies, three by at least 9 different studies and none by all studies.
Heat map of gene expression detection for the hESC gene list across 24 hESC and 193 fetal and adult tissues samples analyzed with the U133A microarray (828 probesets) (C). Red stands for a “Present” detection call (i.e. gene expression confidently detected according to the GCOS 1.2 software), grey for “Marginal” and yellow for “Absent”. Cluster a: genes exclusively expressed in hESCs; b: gene expressed in hESCs and central nervous system samples; c: cell cycle genes; d: genes expressed in hESCs and in most tissues analyzed. The clustering was carried out using the Cluster and Treeview software. Only genes were clustered. hFF: human foreskin fibroblasts; OV: ovary; CNS: central nervous system; PNS: peripheral nervous system; SK: skin and keratinocytes; LU: lung; DT: digestive tract; TH: thyroid; AD: adipocytes; K&P: kidney and prostate; H&M: heart and muscle; HEMATO: various hematopoietic tissues; UT: uterus; PL: placenta.
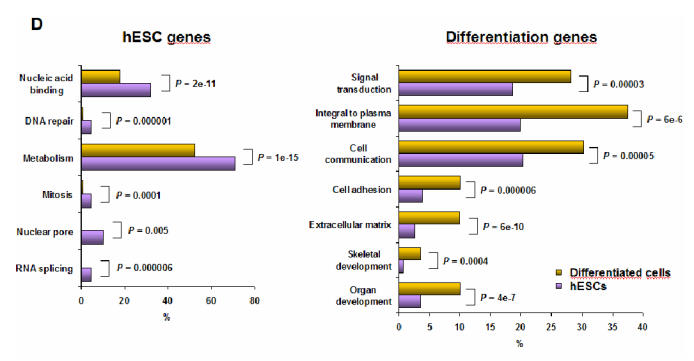
Comparison of GO annotations between hESC genes and differentiation genes (D). We compared the frequency of GO annotations of genes overexpressed in hESCs to those underexpressed in hESCs. The statistical analysis was carried out using the Babelomics webtool (http://babelomics.bioinfo.cipf.es/). Histograms show the percentage of genes with the specified GO annotation in the group of genes overexpressed in hESCs (purple) or in differentiated tissues (yellow). P : adjusted FDR P-value.