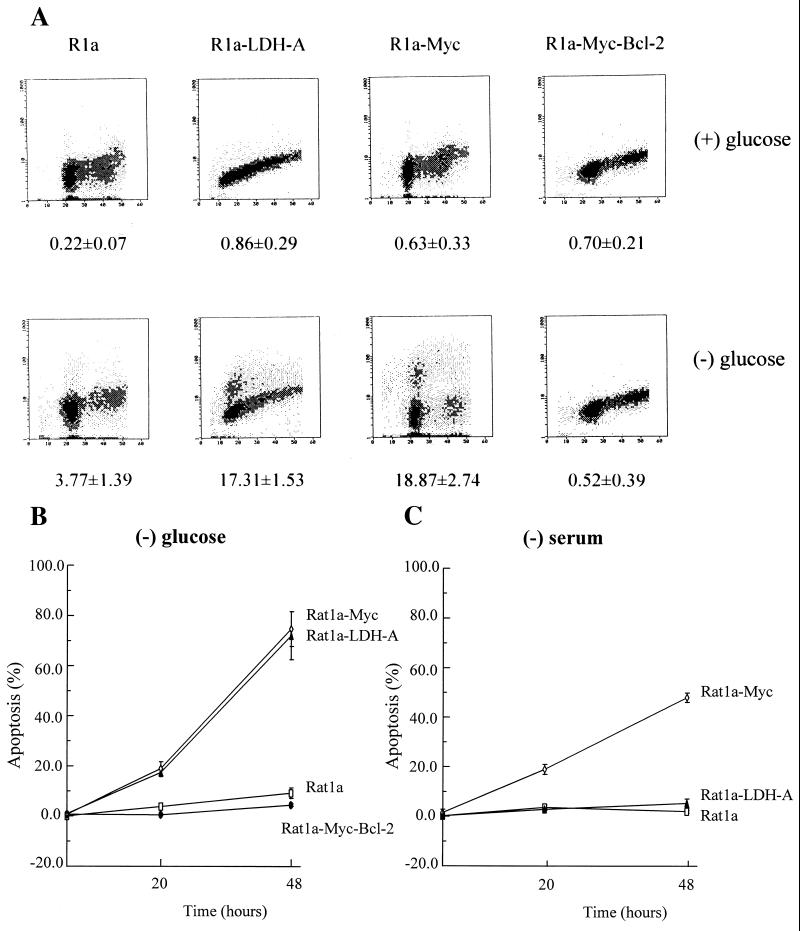
Figure 2.
(A) Glucose-deprivatio-induced apoptotic cell death of c-Myc- or LDH-A-overexpressing cells. Rat1a, Rat1a-LDH-A, Rat1a-Myc, and Rat1a-Myc-Bcl-2 cells were cultured for 20 h in the presence (Upper) or absence (Lower) of glucose. Cells were harvested, and DNA strand breaks were labeled with biotin-dUTP by using TdT and then stained with propidium iodide. DNA content determined by propidium iodide staining is shown on the abscissa and DNA strand breaks content is shown on the ordinate. The numbers below indicate the percentage of cells that were apoptotic and labeled with biotin-dUTP. (B) Time course of glucose-deprivation-induced apoptotic death of Rat1a-Myc and Rat1a-LDH-A cells as compared with Rat1a and Rat1a-Myc-Bcl-2 cells. (C) Time course of serum-deprivation-induced apoptotic death of Rat1a-Myc cells as compared with Rat1a-LDH-A and Rat1a cells.

