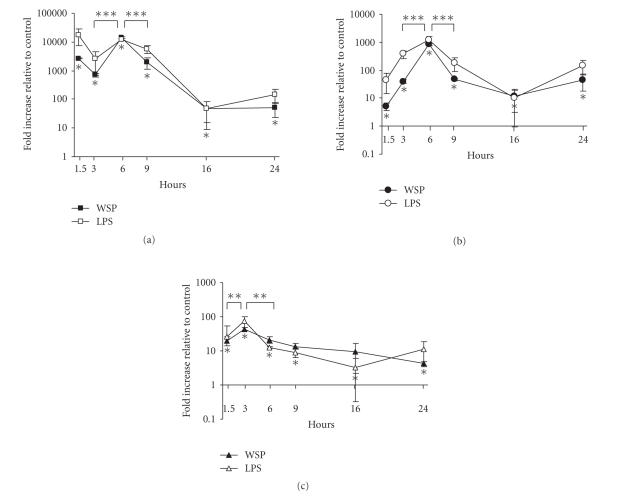
Figure 2.
Time-course analysis of rWSP-induced IL-1â (a), IL-6 (b), and TNF (c) mRNAs expression in murine macrophage RAW 264.7 cells. Incubation of the macrophage cells with 9.0 μg/mL rWSP (black symbols) or 0.1 μg/mL E. coli LPS (white symbols) were performed at various time-points. The data represent mean values and standard deviations of fold increase of cytokine transcripts relative to negative control in log scale. Significant differences to untreated controls are indicated as *P < .05. ** Significant differences were found between rWSP-stimulated cells at 1.5 hours and 3 hours postexposure as well as between rWSP-stimulated cells at 3 hours and 6 hours postexposure (for TNF mRNA levels; P < .05), while *** significant differences were found between rWSP-stimulated cells at 3 hours and 6 hours postexposure as well as between rWSP-stimulated cells at 6 hours and 9 hours postexposure (for IL-1β and IL-6 mRNA levels; P < .01).

