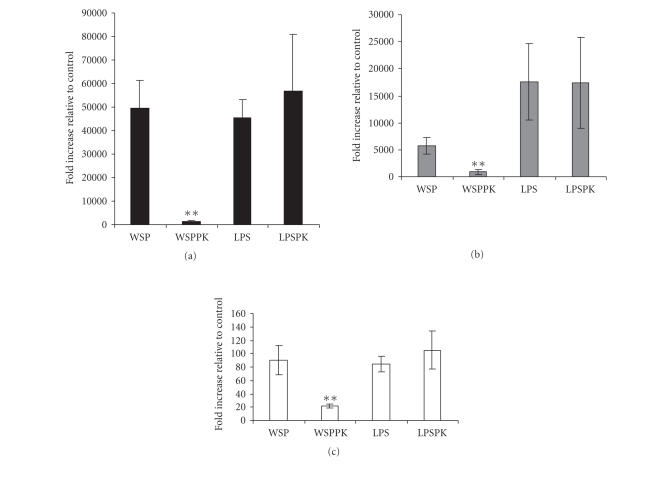
Figure 3.
Effect of proteinase K treatment in rWSP-induced IL-1â (a), IL-6 (b), and TNF (c) mRNAs expression in macrophage RAW 264.7 cells. The macrophage cells were incubated with 9 μg/mL rWSP (WSP), 9 μg/mL rWSP pretreated with proteinase K (WSPPK), 0.1 μg/mL LPS (LPS), and 0.1 μg/mL LPS pretreated with proteinase K (LPSPK) for 3 hours. The data represent mean values and standard deviations of fold increase of cytokine transcripts relative to negative control. Significant differences were found between WSP- and WSPPK-treated cells (P < .05; indicated by **).

