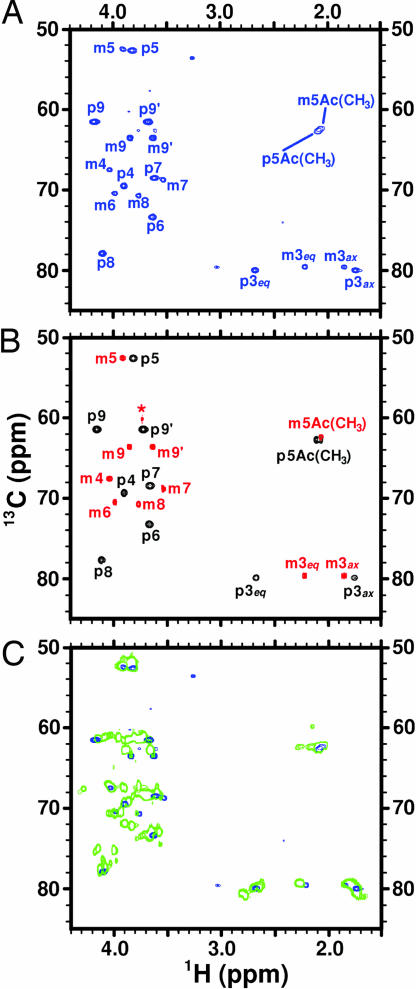
Fig. 2.
1H−13C correlation spectra of PSA under several conditions. (A and B) Numbers identify carbons. m, monosaccharide; p, polysaccharide; eq, equatorial; ax, axial. (A) 1H-13C HSQC spectrum of EV239+neuS cells grown in LB media containing 13C,15N-Neu5Ac. To improve resolution a spectral width of 40 ppm, with carrier frequency at 68 ppm, was used in the 13C dimension, therefore the peaks between 1.50 and 3.10 ppm in the 1H dimension are aliased in the 13C dimension. These peaks have 13C shifts that are 40 ppm lower than they appear. (B) The overlayed 1H-13C HSQC spectra of 13C,15N-Neu5Ac (red) and 13C,15N-PSA at neutral pH (black) clearly show the difference between the monomer (in the β-configuration) and polymer (α-configuration). ∗, identifies the Tris buffer signal. (C) 1H-13C HSQC spectrum of free 13C,15N-PSA at pH 4.0 (green), at which lactone formation is promoted, overlayed with spectrum (A). The number of green contours was purposely limited to better demonstrate the absence of lactones on cells.

