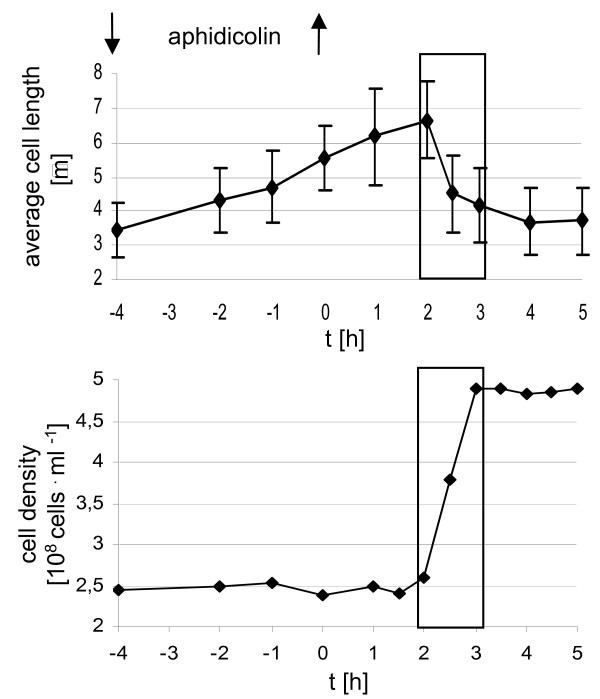
Figure 1.
Optimized synchronization of H. salinarum cultures. The synchronization was performed as described in Experimental Procedures using the DNA polymerase inhibitor aphidicolin. The average cell length and its standard deviation was calculated from the lengths of 50 cells that were determined microscopically with an ocular micrometer. The cell density was determined microscopically with a Neubauer counting chamber. Times of addition and removal of the inhibitor are indicated. The time of inhibitor removal was set to zero to allow a direct comparison of the times shown in this and additional Figures (2 – 6, see Additional file 1). The box in this and additional Figures denotes the only time interval in which dividing cells with visible constrictions could be observed. Microscopic images of dividing cells and the intracellular DNA localization have been published previously [22].

