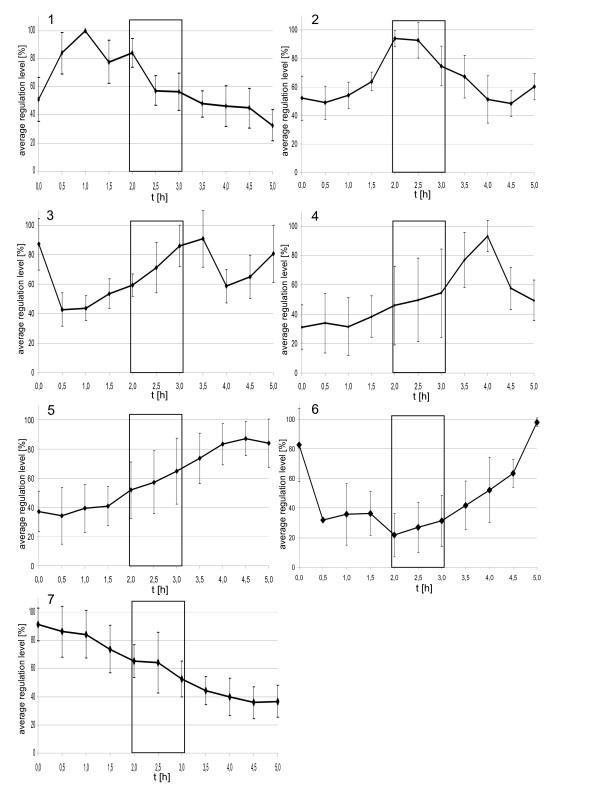
Figure 2.
Average transcript level profiles of seven clusters of co-regulated genes. Most of the cell cycle-regulated transcripts were sorted into seven clusters of co-regulated genes (compare text and Table 1). The average transcription profiles of all seven clusters and the standard deviations are shown. Genes that share an identical profile of induction and repression do not necessarily share the same degree of induction/repression, therefore the transcript profiles of all genes were normalized to their highest value (= 100%) before calculation of averages and standard deviations. Gene identifiers, names, and functional classes are summarized in Table 1.

