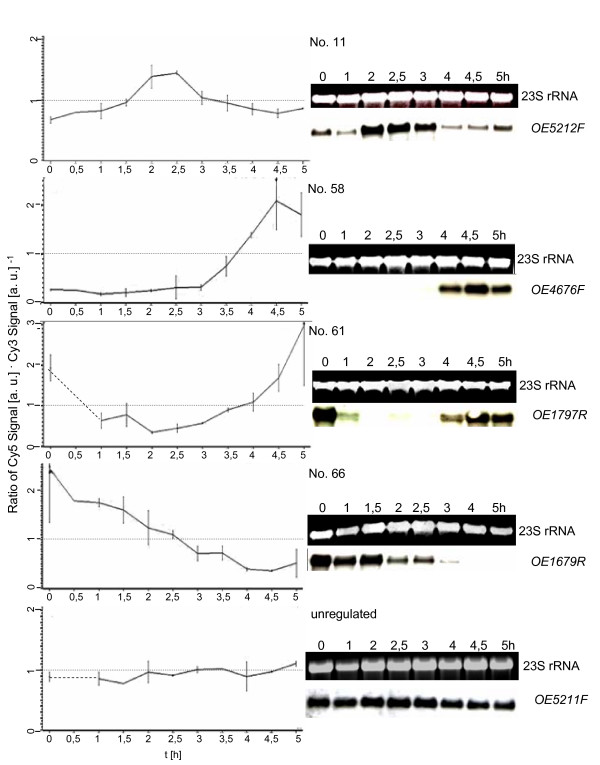
Figure 3.
Comparison of results obtained by DNA microarray analysis and by Northern blot analysis. 13 genes were selected for verification of the microarray results with an independent method, i.e. Northern blot analysis. They represent all clusters of co-regulated genes as well as unregulated control genes. The transcript level profiles obtained for individual genes by microarray analysis are shown on the left side (average of three biological replicates). On the right side the results of Northern blot analysis are shown (one typical experiment). Gene identifier [23] and the gene No. in Table 1 are included.

