
Figure 1.
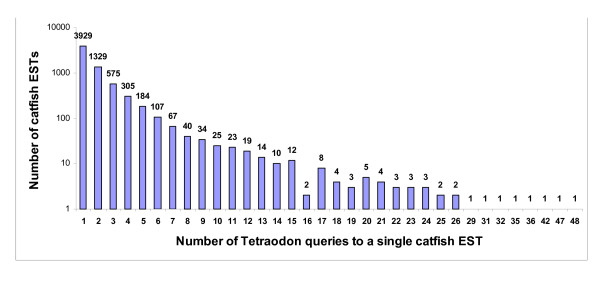
Bar graph of distribution of Tetraodon gene hits on catfish ESTs. For example, 575 catfish ESTs were each hit by three Tetraodon queries. A logarithmic scale was used for the Y-axis to better show the wide range of values.
Official websites use .gov
A
.gov website belongs to an official
government organization in the United States.
Secure .gov websites use HTTPS
A lock (
) or https:// means you've safely
connected to the .gov website. Share sensitive
information only on official, secure websites.
Bar graph of distribution of Tetraodon gene hits on catfish ESTs. For example, 575 catfish ESTs were each hit by three Tetraodon queries. A logarithmic scale was used for the Y-axis to better show the wide range of values.