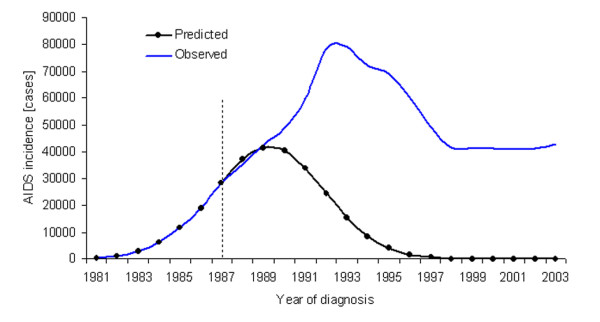
Figure 1.

Observed and predicted AIDS incidence in the United States from 1981–2003. Data source: refs. [26,27]. Details of the underlying assumptions employed are described in the Additional file. The prediction was obtained using the data up to the dashed line; i.e., from 1981–7. The constant second ratio of AIDS incidence was 0.8647, as adopted in ref. [22].
