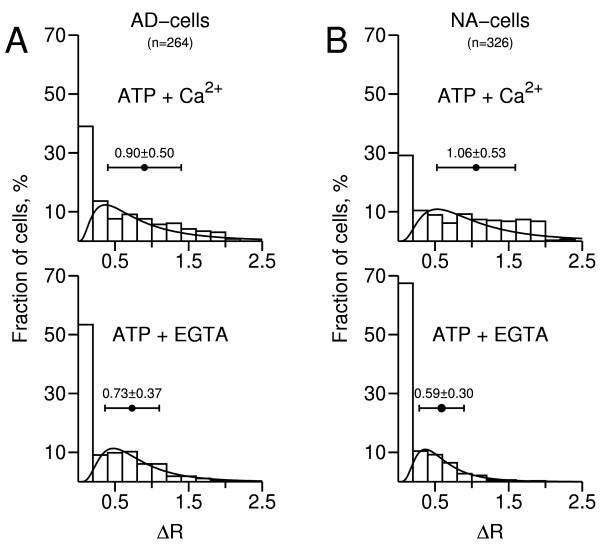
Figure 3.

Frequency distribution histograms of calcium responses to ATP. Changes in ΔR= F340/F380 were determined from the experiment depicted in Fig. 2 and 9 similar experiments (n = 590 cells). The first column in each histogram represents unresponsive cells (ΔR < 0.2). "ATP + Ca2+": responses obtained in presence of extracellular calcium; "ATP + EGTA": responses obtained in the virtual absence of extracellular calcium. A, leftmost histograms: AD-cells; B, rightmost histograms: NA-cells. A lognormal distribution function was fitted to each histogram, not taking into account unresponsive cells. The horizontal bars represent mean ΔR ± S.D.
