Figure 1.

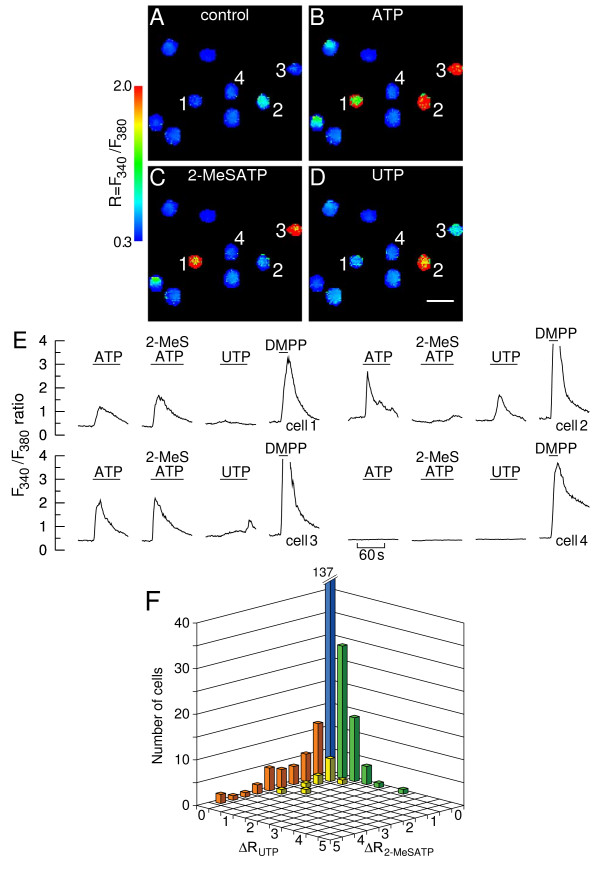
Calcium responses to ATP, UTP and 2-MeSATP. A-D. Calcium images showing a group of chromaffin cells before (A, "control") and during stimulation with 100 μM ATP (B), 100 μM 2-MeSATP (C) and 100 μM UTP (D). At the end of each experiment cells were stimulated with 10 μM DMPP. Cells were allowed to rest for ~10 min between consecutive stimulations. The fura-2 fluorescence ratio F340/F380 was determined for each cell in a field on a pixel-by-pixel basis. Images were coded in pseudocolor to show differences in the F340/F380 ratio. The images corresponding to agonist stimulation (B-D) were captured at the response peaks. Calibration bar: 50 μm; E. Time courses of changes in F340/F380 fluorescence ratio for a 2-MeSATP-sensitive/UTP-insensitive cell (cell 1), an UTP-sensitive/2-MeSATP-insensitive cell (cell 2), a cell displaying a mixed response (cell 3) and an ATP-insensitive cell (cell 4). The lines denote superfusions with DMPP or purinergic agonists. Some of the peak responses to DMPP were truncated for scaling reasons; F. Frequency distribution histogram of calcium responses. Changes in ΔR = F340/F380 were determined from the experiment depicted in A-D and 2 similar experiments (n = 234 cells). The column at the origin represents cells that did not respond to either UTP or 2-MeSATP (ΔR < 0.5, n = 137 cells). This column was truncated for scaling reasons. Columns in orange: cells responding to 2-MeSATP only; columns in green: cells responding to UTP only; columns in yellow: cells exhibiting mixed responses.
