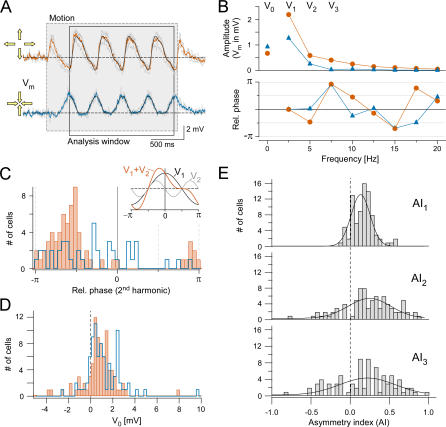
Figure 2. Quantification by Fourier Decomposition.
(A) Voltage responses evoked by circular wave stimuli; gray: individual trials, orange and blue: averages for CF and CP motion, respectively; black: reconstructed waveforms; frame: trace segment used for analysis (V Rest = −60 mV).
Gray area indicates motion duration.
(B) Amplitudes (top) and relative phases (φ 2 − 2 · φ 1, bottom) versus frequency (f ) for the averaged responses in (A). Symbols (V 0 at f = 0; V 1 at f 1; V 2, V 3... at 2·f 1, 3·f 1,...) are measured points; connecting lines are only a guide for the eye. Note that the phases for the CF motion decrease linearly except when wrapping around (at −π, π). Reconstructions of the waveforms using V 0–3 and their phases shown as black traces in (A).
(C) Histogram of the relative (rel.) phase shift (φ 2 − 2 · φ 1) between fundamental and second harmonic (orange for CF, n = 65; blue for CP motion, n = 41 cells; only cells with V2 ≥ 0.3 mV included; stimulus: 2.5–3 Hz; 46%–73% contrast; period: 192 μm). Inset: fundamental and second harmonic generate a steeply rising flank when the relative phase is close to −π/2.
(D) Distribution of V 0 (n = 83, same cells as in [C]) for CF (orange) and CP motion (blue).
(E) Distribution of asymmetry indices, AI 1, AI 2, and AI 3 (n = 83 cells; all AIs are significantly different from zero with pAI1,AI2,AI3 ≤ 0.0001).

