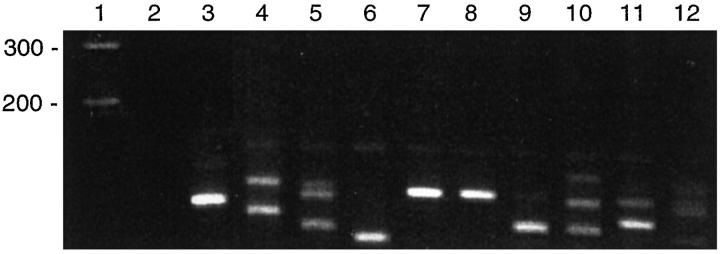
Figure 3.
IgH PCR on microdissected reactive germinal centers. Approximately 50 cells were used per reaction. Lane 1: molecular weight marker. Lane 2: negative (H20) control. Lane 3: positive (monoclonal) control. Lanes 5 and 10 show an oligoclonal pattern. Lanes 4, 6–9, and 11 show a pseudomonoclonal pattern (one or two bands). Lane 12 shows a polyclonal (smear) pattern. Note that lanes 7 and 8 show products of identical size even though the DNA used was extracted from separate germinal centers that were distant from one another.

