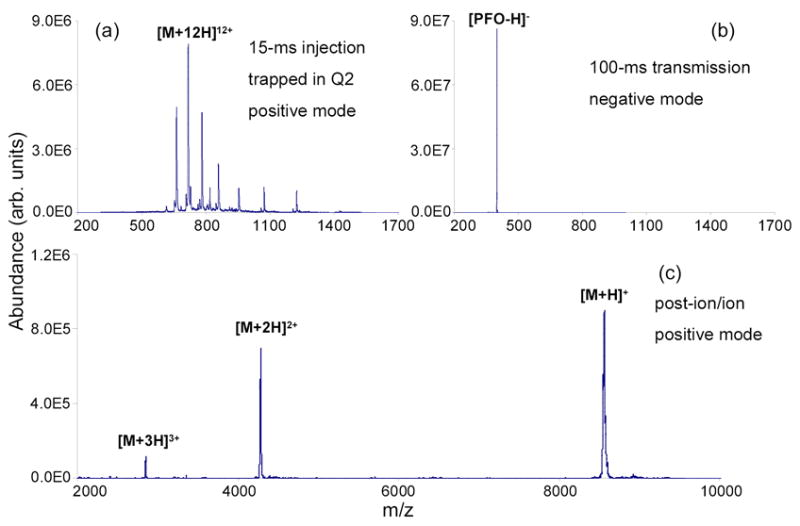
Figure 1.

Mass spectra derived from transmission mode ion/ion charge reduction reaction: (a) 15-ms positive nano-ESI of 10 μM bovine ubiquitin (trapped), (b) 100-ms negative nano-ESI of 200 μM PFO (passing), and (c) post-ion/ion spectrum acquired at 50 kHz ejection frequency after 100-ms reaction of ions shown in (a) and (b).
