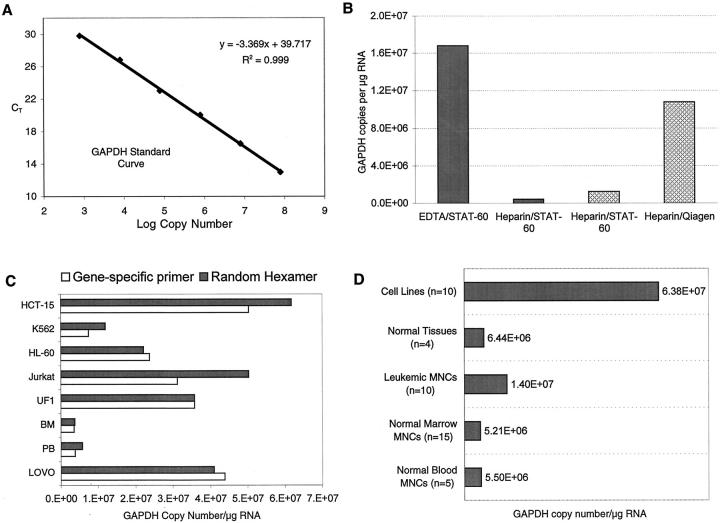
Figure 2.
GAPDH copy number related to sample processing technique, type of primer used to initiate cDNA synthesis, and tissue source. A: GAPDH standard curve generated with 10-fold serial dilutions of GAPDH plasmid standards. B: Effects of sample processing and RNA extraction. Solid columns: bone marrow was collected in EDTA or heparin and RNA was isolated using STAT-60. Cross-hatched columns: bone marrow was collected in heparin and cryopreserved. Vials were thawed, divided into two aliquots, and RNA was extracted using either STAT-60 or Qiagen RNeasy columns. In all cases, equivalent amounts of RNA (measured by spectrophotometry) were reverse-transcribed into cDNA and equal amounts of cDNA were amplified using GAPDH primers and probe. The number of GAPDH copies was determined by reference to the GAPDH standard curve shown in A. C: Comparison of random hexamers to gene-specific primers in cDNA synthesis. Equal amounts of the RNA from the cells shown were reverse-transcribed into cDNA using either gene-specific primers or random hexamers, and GAPDH copy number was calculated from the same amount of cDNA equivalent using real-time PCR. D: GAPDH copy number/μg of RNA from different tissue sources. The cell lines were a mixture of hematopoietic and epithelial cells. RNA from normal tissue (spleen, placenta, colon, and lung, all pooled) was purchased from Clontech. All RNAs, except those purchased from Clontech, were isolated using Qiagen RNeasy columns.

