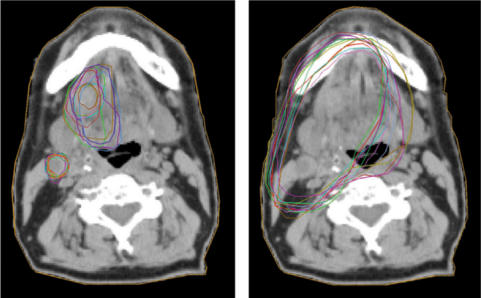
Figure 7.
Example of interobserver variation (11 radiation oncologists) in the delineation of (a) GTV-T and GTV-N and (b) the resulting PTVs for a patient with cancer of the tongue with a homolateral lymph node deposit. From a ‘dummy-run’ in the ARTSCAN project (Zackrisson, personal communication, 2006). The images were produced with the CERR software package[37].

