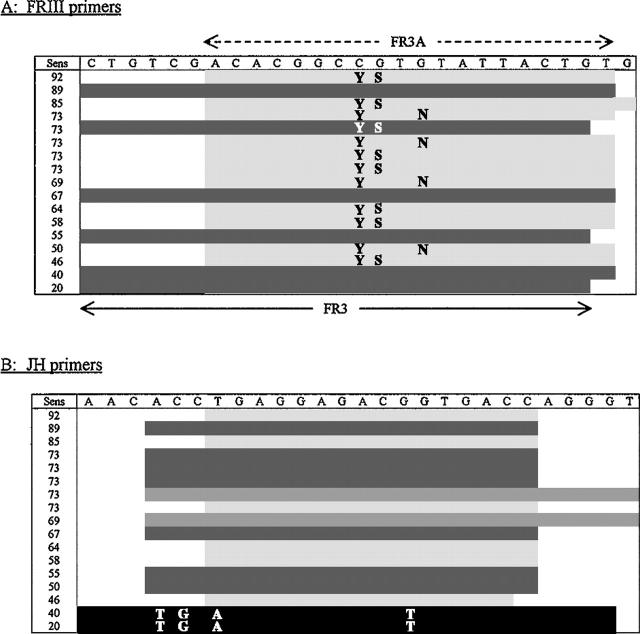
Figure 1.
Immunoglobulin heavy chain gene primers. Sequences (5′→3′) of IgH primers used by the individual laboratories, ranked according to ability to detect a monoclonal IgH rearrangement in the distributed B cell lymphoma specimens. Sens; sensitivity, expressed as a percentage detection for each individual laboratory. A: FRIII primers. As compared with FR3A, FR3 has an extra six 5′ bases and one less 3′ base. The letters in the body of the table reflect nucleotide wobble in the primer sequence (Y, C/T; S, G/C; N, G/A). = identical or similar to FR3A sequence (average detection rate, 69.7%). = identical or similar to FR3 sequence (average detection rate, 54.7%). This difference in detection rate is significant (P = 0.03). B: JH primers. The letters in the body of the table reflect the variation in the primer nucleotide sequence, as compared with that designated at the top. = identical or similar to JHa sequence (average detection rate, 70.4%). = identical or similar to LJH sequence (average detection rate, 69.4%). = identical or similar to CFW1 sequence (average detection rate, 70.8%). = variant sequence (average detection rate, 30%). This difference in detection rate for the variant sequence is significant (P < 0.0001).

