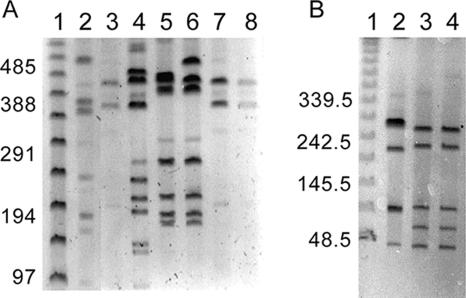
FIG. 2.
MRP-PFGE profiles of C. jejuni isolates. Lanes 1 (A and B), PFGE lambda ladder (New England Biolabs, Beverly, MA). The sizes of the molecular mass markers are shown on the left of each panel in kilobase pairs. (A) MRP-PFGE of SmaI-digested DNA from 81-176 (lane 2), CS (lane 3), S1 (lane 4), S2B (lane 5), S3 (lane 6), SC (lane 7), and Turkey (lane 8). (B) MRP-PFGE of SalI-digested DNA from 81-176 (lane 2), Turkey (lane 3), and CS (lane 4).

