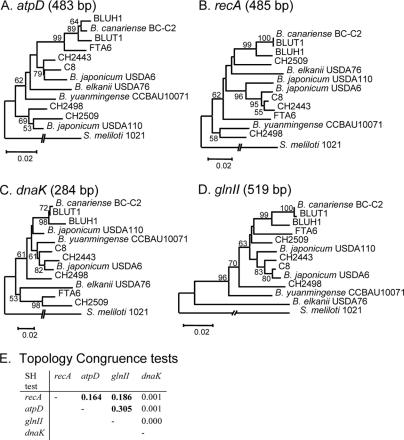
FIG. 2.
Comparison of the atpD (A), recA (B), dnaK (C), and glnII (D) gene fragment phylogenies (size of the alignment used for each marker is in parentheses). Trees shown were constructed by NJ, from a Kimura 2P distance matrix. Node robustness was evaluated by using 1,000 bootstrap replications. (E) Summary of S-H tests of congruence of tree topologies among ML phylogenies of the four markers (trees not shown). ML settings for each marker were of two types: a gamma distribution of site substitution and an estimating-base-frequency substitution. Boldface values indicate P values greater than 5% between two tree topologies, meaning the topologies are not statistically different by the S-H test.

